

Using FinAilyse - a practical example
Having introduced FinAilyse in a previous blog post, today I would like to show the app in action on a real task. The goal is simple: demonstrate how a corporate treasurer or market risk manager can use it to get from question to answer quickly, without compromising on analytical quality. I will focus on the business value - I promise not to get too technical..
The problem we will solve today starts with a typical question that a CFO might ask:
What EURPLN risk are we facing in the near term and are we sufficiently hedged?
Anyone who worked in corporate treasury recognises this - the CFO doesn’t have the time to formulate his question more precisely. Nor the patience to wait three days while his busy team team sources data, runs the analysis, and produces a report.
To answer the CFO's question quickly and accurately, we will hand the task to FinAilyse.
What do we have as input
Three things. First, an Excel file containing our future EUR exposure, which we upload directly into the app.
Second, a set of generic instructions — guidelines that we want the app to follow every time, so that we don't need to rewrite them with every new analysis. In our case, these instructions will be:
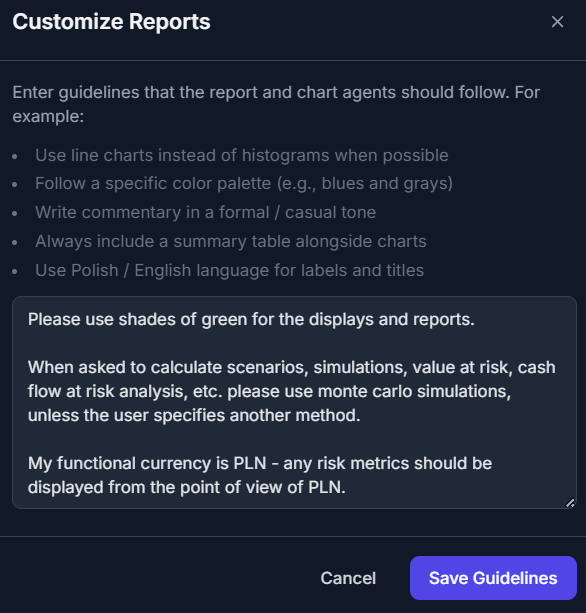
Notice that these three short lines already eliminate several potential ambiguities before we ask a single question the the LLM. The preferred simulation method, the reporting currency and some guidance on the visual style are pre-specified. These instructions are likely to evolve as we keep using the app and learn to "understand each other".
Third, a we need a more precise version of the CFO's question. The original request is too vague — left as-is, it would give AI agents too much room for interpretation. Here is what we actually asked:
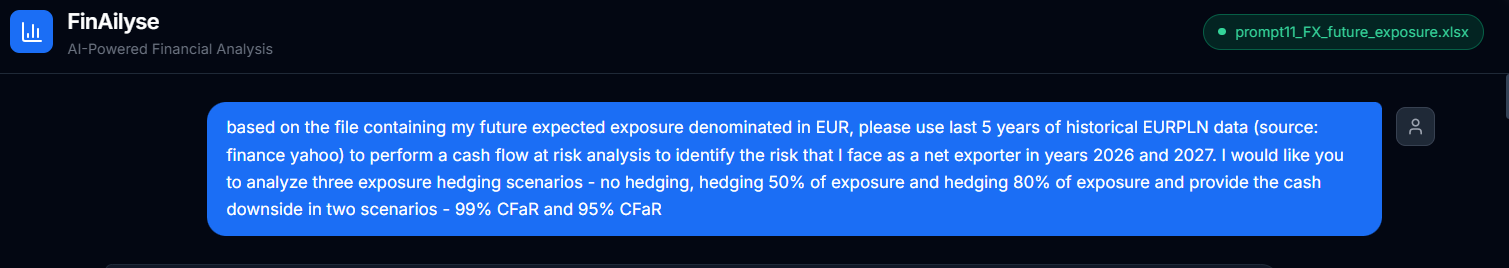
Notice how much more specific this is than the CFO's original question. We defined the data source, the time horizon for historical data, the type of analysis, the hedging scenarios, and the confidence levels. That said — and this is important — there is still room for interpretation, We will come back to this topic shortly.
That's all we prepared as input. Now, let's see what the app does.
What happens next
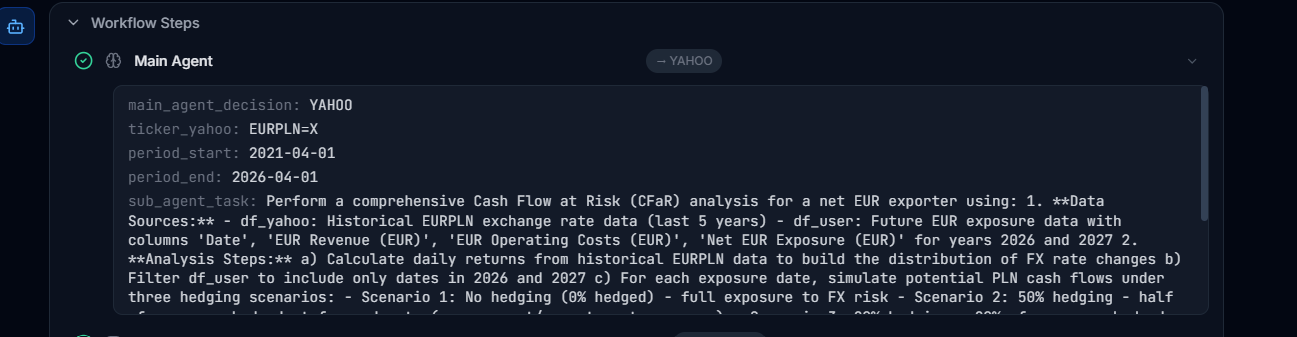
The agent begins by breaking the task into smaller components — what data it needs, where to get it from, for what time period, and what exactly needs to be done at each step. All that breakdown is available to the user:
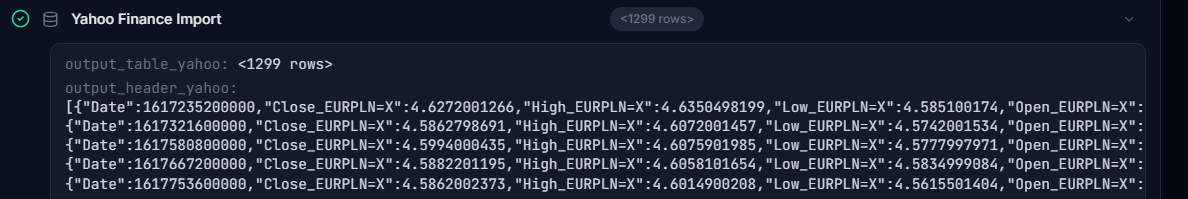
Second, it retrieves the data:
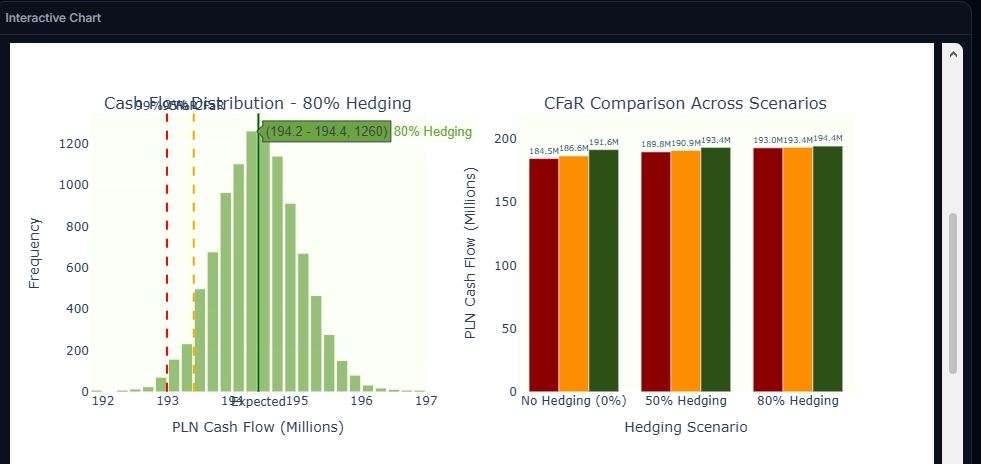
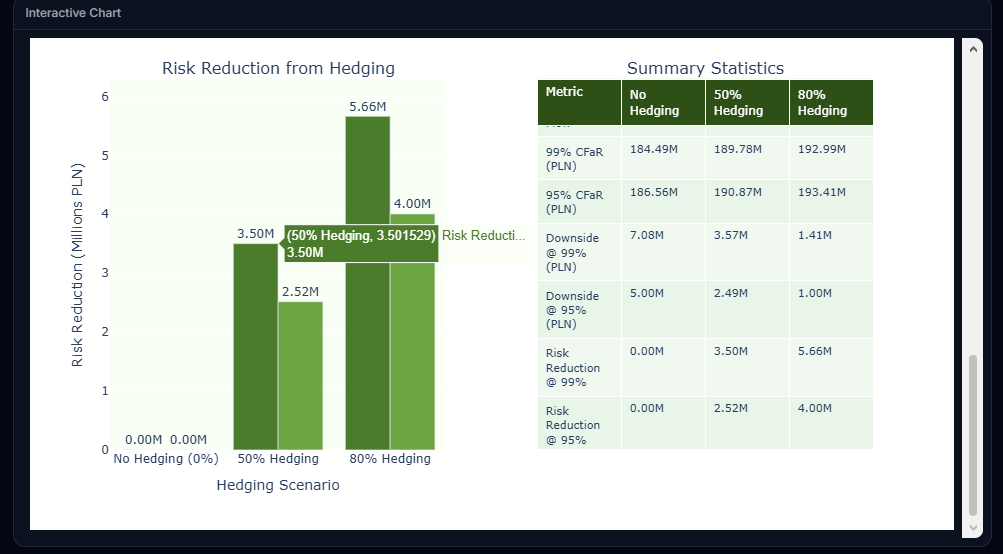
Third, the most demanding step begins. The agent decomposes the analytical task into a sequence of operations: translate exchange rates into returns, estimate the parameters for simulation, run the Monte Carlo simulation, match the simulated paths agaiit nst the exposure schedule, calculate Cash Flow at Risk scenarios, and produce the output charts. And finally, runs the analysis. In the test run, this step took about five minutes — including the time the agent spent reasoning through each sub-step and the time the simulation needed to execute. The result is a set of interactive graphs:
What happened in the background? The agent produced a reusable Python script, executed it, and generated the interactive reports. If I want to verify the correctness of the calculations, I can download the script and audit it independently.
How do I know whether what the agent produced is correct?
When working with LLMs, regardless of the case study, this question is a no-brainer - especially when dealing with financial data where there is no room for ambiguities. The answer has two layers, and it is worth separating them clearly.
The first layer is computational correctness. By design, all numerical calculations in FinAilyse are deterministic — they are executed by a Python script, not "generated" by the language model. If the script ran without errors, it means that the arithmetics are correct. There is no concept of "hallucinations" in the computation itself. Two plus two will always be four. The Monte Carlo paths, the CFaR percentiles, the scenario comparisons — these are all computed, not estimated by the AI.
The second layer is methodological — and this is where it gets more interesting. For such a complex request as the one we asked (let's be honest here - most real-world requests are complex) there is still room for interpretation - let me walk through some examples.
Some ambiguities were already eliminated by the generic instructions we defined earlier. The simulation method — Monte Carlo — was pre-specified, so the agent did not need to choose between Monte Carlo, parametric approach, or historical simulation. The functional currency — PLN — was determined, so there was no room for the agent to misinterpret the risk profile.
But several assumptions remained open. Here are some examples:
CFaR definition. The term "Cash Flow at Risk" carries some degree of ambiguity. It can mean the worst-case PLN outcome at a given confidence level in absolute terms. Or it can mean the deviation from the expected (mean) scenario. Both conventions are used in practice. The distinction is particularly relevant when presenting results to a CFO who may interpret the number as "the most I can lose" versus "how much worse than expected it could get."
Return distribution. Within the Monte Carlo simulation, the agent had to decide what distribution to fit to the historical returns. He chosed the standard log-normal assumption. But FX returns exhibit fat tails. Extreme moves happen more often than a normal distribution would predict. At the 95% confidence level, the difference may be modest. At 99%, it can be material. A Student's t-distribution, or a model that explicitly accounts for tail risk, would produce wider confidence intervals.
Volatility estimation. We specified five years of historical data. But how should those five years be weighted? The simplest approach treats every observation equally — a day in 2021 carries the same weight as a day last week. An exponentially weighted model would give more influence to recent observations, reflecting the argument that recent volatility is more informative about near-term risk.
None of this means the analysis performed by the agent is wrong. The agent made reasonable choices, and for the purpose of a rapid first assessment — which is what the CFO actually needed — the output might be more than sufficient. But a risk manager reviewing the results should be aware of where the assumptions sit, and should know which ones to tighten if the analysis moves from an initial estimate to a basis for real-world hedging decisions. In any case, via an iterative approach, the app can gradually produce the exact requirement of the risk manager.
This is where FinAilyse has the biggest advantage over a "simple" chatbot that has access to the relevant data: because the agent produces a downloadable script, every assumption is visible and auditable. If I disagree with a modelling choice, I can either adjust the script directly or — more practically — refine the prompt and ask the agent to re-run the analysis with explicit instructions on the disputed parameter. For example: "Re-run the analysis using EWMA volatility with a decay factor of 0.94 and assume a Student's t distribution of returns instead of a lognormal one."
The general principle is: the more specific the prompt, the less room for interpretation. For a quick directional answer, the prompt we used is adequate. For a report that will inform actual hedging decisions, it would be worth specifying things like the distribution assumption, the volatility weighting scheme, and the hedge mechanics explicitly. As you see, for the purpose of this test, we were still a bit lazy writing the prompt.
From analysis to a ready-to-send report
Let us assume I reviewed the results, I understand the assumptions behind them, and I want to send the CFO something presentable. I ask FinAilyse to produce a PDF report.
I can download it immediately, or continue the conversation — request additional calculations, different chart types, alternative presentations of the results, or ask the agent to explain and defend its assumptions.
Making the work reusable
Suppose now that the CFO liked the report. Next month, or next quarter, or next day, I will need to run the same analysis again — perhaps for USD exposure, or for a different time horizon. In FinAilyse, I save the report with a single click.
What is worth mentioning is that the report that is saved does not get a name assigned. Instead, the next time I type a question into the chat, the app scans its repository of saved analyses for similar requests and asks whether I want to reuse a previous report or start fresh. In this case I get certainty that the exact same analysis will be re-run, but for a different dataset. No need to remember report names. No need to recall what each report does.
The save feature can also work across variations. If next time I want to analyse the joint effect of EURPLN and USDPLN on my full foreign currency exposure, the app will produce a report that mimics the layout and logic of the single-currency version — extended with features specific to the multi-currency case, such as cross-currency correlation analysis. Same structure, broader scope, no need to rebuild from scratch.
What this means in practice
A question that would normally take a lot of analyst time — data collection, spreadsheet assembly, simulation setup, report formatting — was answered in just a few minutes. The output is auditable. The methodology is transparent. The report template is saved for future reuse.
Equally important: the correctness section above is not a caveat — it is the point. A good analytical tool does not hide its assumptions. It makes them visible, so that the domain expert can evaluate them and decide where to push further. The treasurer's time was spent where it belongs: understanding what the numbers mean, not producing them.
The beta version of FinAilyse is available here. If you want to try it yourself, please reach out at skaminski@aibreaker.eu for credentials. You can also send me questions you are curious how the agent will answer — I will show you how the app handles them.